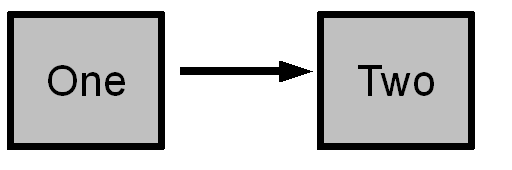
There is one basic document functionality that none of HTML, CSS, nor SVG can do. None can represent one box, another box, and a link between the two.
The most fundamental feature of HTML is the hyperlink, But while
〈a id="one" href="#two"〉Linking to #two〈/a〉
 〈a name="two"〉Linked to from #one〈/a〉
could be represented by the above graphic, a HTML hyperlink doesn’t represent this itself.
CSS is good at drawing boxes, but it can’t show relationships between boxes. Using CSS there would be something missing between boxes one and two.
SVG can draw the rectangles and with a little trouble an arrow between the two. However it will do this as three unconnected graphics, two boxes and one arrow. This doesn’t represent any relationship between the boxes. As far as SVG is concerned the middle graphic could just as well be a tiger between two rabbits.
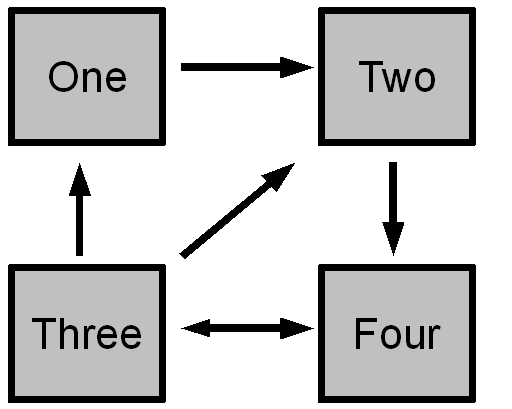
HTML5 is getting one step closer with the datagrid element. A datagrid element “represents an interactive representation of tree, list, or tabular data.” The above graphic could be seen as a very simple list (the list could continue with two linking to three, three linking to four, and so on), or even as a very simple tree (a tree could be extended with one linking with three, either of these linking with four, and so on). Lists, trees, tables are basic data structures, but they are all special cases of this:
Graphs in theory and practice
The above illustrates a general graph, where any box can link to any other box. A graph can be represented by a tree or a table like the one below, but both representations lose the graphiness of the graph.
This particular graph is a directed graph, usually represented by using arrows, where box One points to box Two. If the direction doesn’t matter, when box One links to box Two then box Two also links to box One, the relationship between the boxes is represented with lines instead. The double arrow between Three and Four is stylistic, it could also be represented with two arrows, one going from Three to Four and another going from Four to Three, or indeed by just drawing a line between Three and Four.
It is also a connected graph, from any box you can reach any other box by following the arrows. The concept of connectedness is a little more tricky for directed graphs than for undirected ones. In the first example box One was connected to every other box (namely Two), while box Two is connected to no other box (there is no arrow from Two to One). If things like that interest you, look up Graph Theory.
  From  | To
 -------+-------
  One   | Two
  Two   | Four
  Three | One
  Three | Two
  Three | Four
  Four  | Three
 -------+-------
Representing and presenting graphs
In XML the first graph could look something like this:
<box label="one">
   <link ref="two"/>
 </box>

 <box id="two"/>
Since any XML document is a tree, this is an example of a tree representing a general graph. The second graph could be represented like this:
<box label="one">
    <link ref="two"/>
 </box>

 <box label="two">
    <link ref="four"/>
 </box>

 <box label="three">
   <link ref="one"/>
   <link ref="two"/>
   <link ref="four"/>
 </box>

 <box label="four">
    <link ref="three"/>
 </box>
The similarity to hyperlinks in the above code is no accident, the World Wide Web is one big unconnected directed graph.
Even though we now can represent this graph, we still can’t display it. We would need CSS magic to do that, something like:
 box {display: inline-block}

 link {
    display: graph-connection;
    connection-type: directed;
    connection-source: parent;
    connection-target: attr(ref, url);
    connection-label: attr(title);
    connection-glyph: arrow.svg;
    connection-padding: 1em;
    connection-path: direct;
 }
Usually an element is presented as some sort of box, but the link element is supposed to be presented as a link between the containing element (the box element here) and the element linked to. The element linked to (connection-target) would be found in the ref attribute. For this purpose I used the CSS3 attr function (though at least in this incarnation the draft includes the URL type and not the IDREF type, so in the above markup I would have to rewrite the XML format to use href=”#one” instead of ref=”one” if I wanted it to work with CSS). Most of the properties of a graph would be a matter of style, what kind of arrows or lines to use, from where to where the lines would be drawn and so on.
Managing boxes
Above the box elements were given the display-type inline-block. This works after a fashion, and as a container a box should act like a block-type element. However when drawing boxes neither the inline-block or the block types are approprate. The table-cell display type is better, but apart from the need for additional table-row type elements, graphs in general don’t look much like a table (though my two examples could be laid out on a 1×3 and 3×3 table under duress).
Graph boxes (nodes, vertices, they have several names) are laid out on a grid system. The CSS3 Template Layout module has proposals for how to do grids and should be able to handle graphs. For now I just assume that it should be possible to define a display: graph-node; type that would have reasonable defaults for drawing graphs, with the possibility to override those positioning values as required.
The easiest scenario is that the graph is coded in layout order, followed by one where grid coordinates is given for each box within a coordinate system set by the containing element.
The most magical scenario would automatically reorganise the boxes for maximum visual clarity, like minimising the lengths of the arrows and the number of crossing arrows. This works very well for abstract graphs, but is computionally demanding and would not make the rendering pixel perfect (unless the same algorithm was used). Furthermore for many graphs the positioning contains information, e.g. traditionally in a time-based graph an earlier box would be to the left of a later box. Done right this embedded positional information could be used to represent the same graph in an alternative manner. For now I would assume that CSS won’t do advanced magic.
A Different Perspective: Visualising Links
Given a way to visualise graphs it would be possible to generate a visual representation of internal and external links in a document.
a[href], [id] {display: graph-node} /* Link elements and potential target elements */

 a[href] {
    display: graph-connection;
    connection-type: directed;
    connection-source: self;
    connection-target: attr(href, url);
    connection-label: contents;
    connection-glyph: arrow.svg;
    connection-path: coordinates;
 }
In this case the URL type would be the appropriate one for the attr function.
While this gives a representation of the links in a document in a real document with multiple redundant links to the same location this would provide too much information to be useful, and many elements with id or name may not be link targets and clutter up the graph. Probably a JavaScript function to clean up the elements would be more practical.
Originally published on My.Opera.com
Anonymous writes:Thanks for the interesting post! I am in the unfortunate position of having to render a graph with the tools that we have available now (especially hard as IE does not support display:table-cell or SVG). But it’s good to know that it might get easier in the future.
Anonymous writes:I think I’ve finally reached a wall. I’m soooo sick of programming these puzzles! I’m about to retire from this job, it blackens my soul.
Anonymous writes:This sounds a lot like this hosted PBX line we’re trying to use. It sends our messages to all of these different boxes, I don’t know, the more I talk about it. The more I feel like an idiot lol. The algorithm just feels the same. That and I’ve been messing with it for the past few days, and can’t stop thinking about it.
Anonymous writes:So you’re saying a link can’t do it all, but a handful of links can. That’s a pretty simple and easy way to understand the subject. It’s just like mobile analytics. You can’t just have a phone, computer, or a server. You need all three in order to track analytics. Just like you need all of the links working together to get to your solution.