From peak emission to peak population to peak car, we are about to enter a series of turning points. What does this mean?
Global peaks
2012: Peak birth
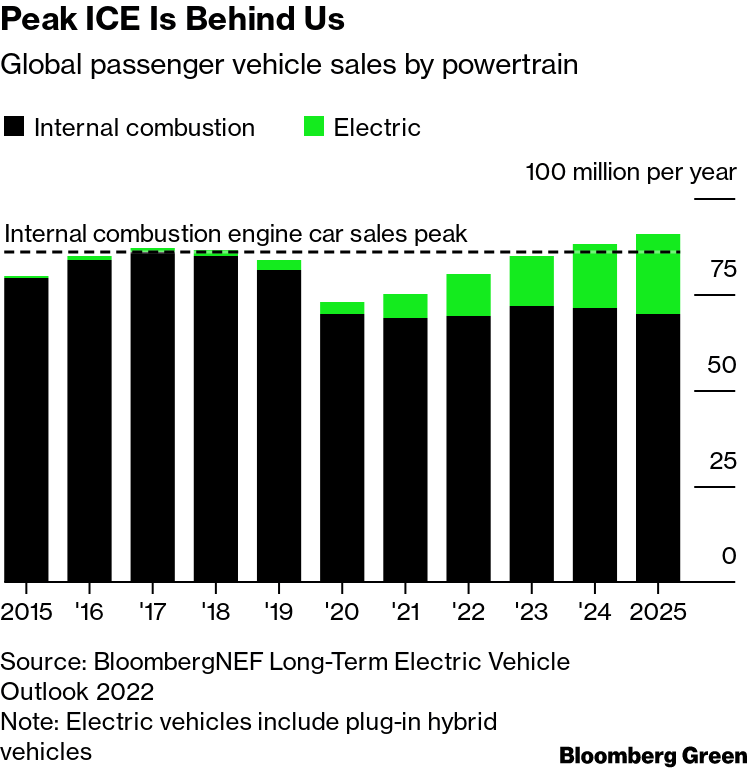
2017: Peak ICE car sales
2020: Peak child
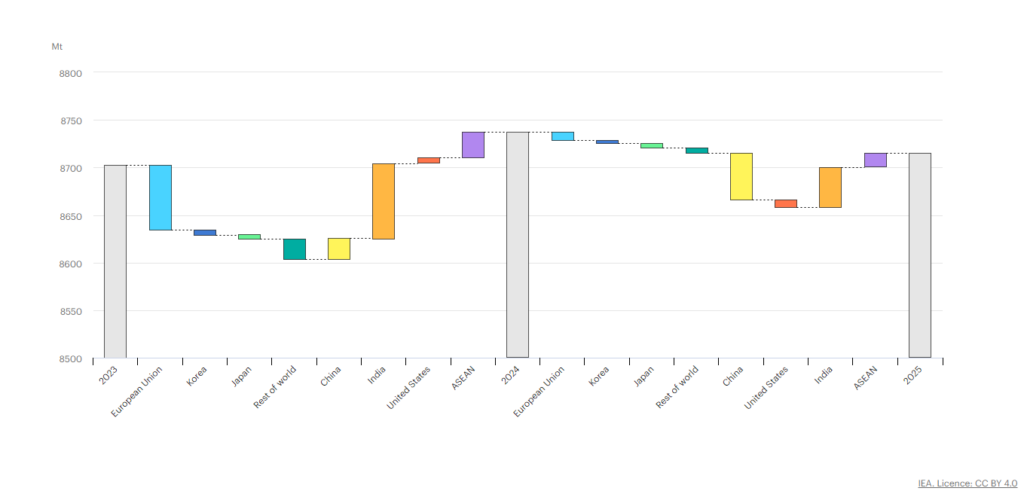
2024: Peak emissions, oil and coal
2038: Peak ICE vehicle fleet
2040: Peak meat?
2082: Peak population
Things change. But how do we know that? We can notice, sometimes measure, the effects of change, but it is hard to discern from variation, differences that happen when things haven’t changed.
To do so, we use indicators, measurements that are regularly taken and published pointing to outcomes of processes we may or may not know. They in turn have drivers we may or may not know. If we knew the wheels driving and impeding change, we may make simulations and scenarios to play out what would happen if they differed in strength or position. We can tell the future.
Mostly we don’t, and have to rely on indicators and other data to test our models and keep us honest. Indicators come in lagging, indicating change that has actually happened, and leading, change that may happen.
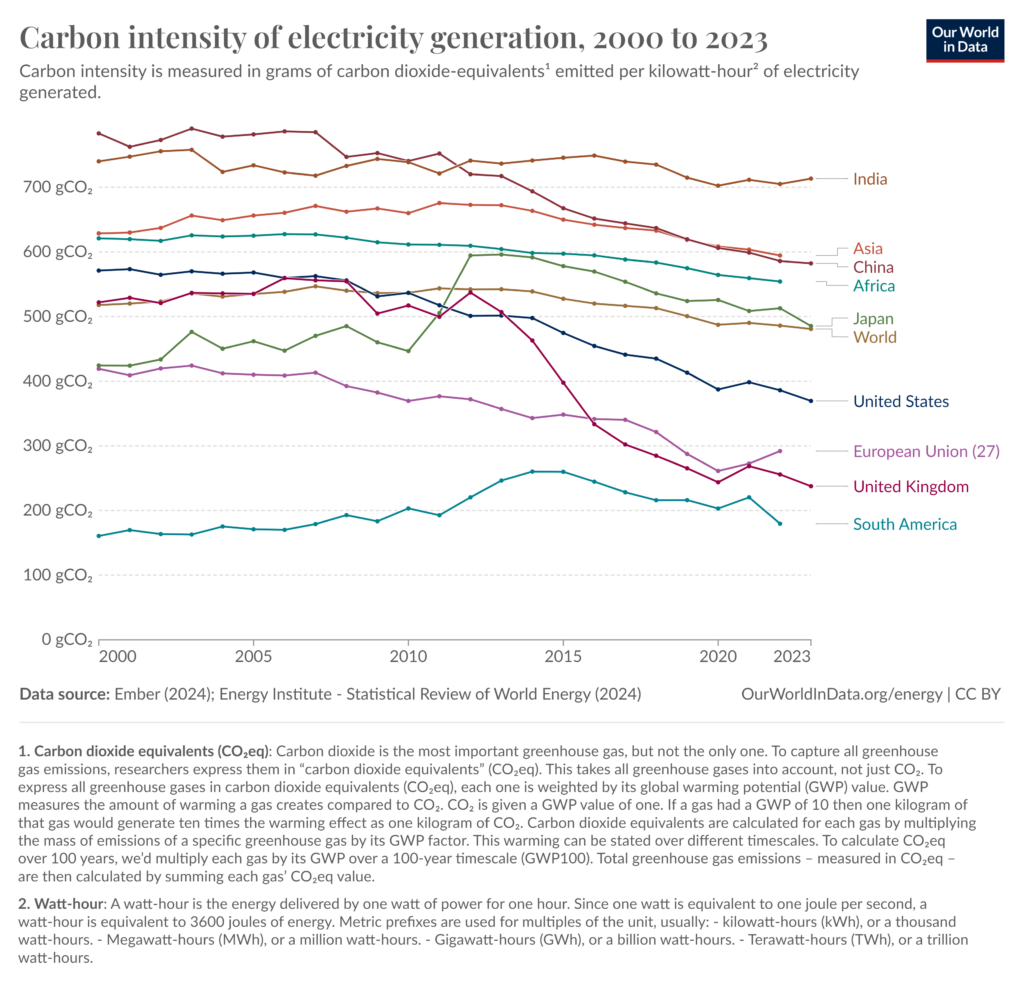
How is the climate changing?
The obvious indicator for climate change is how much CO₂ is in the atmosphere in parts per million (PPM). That has been fairly stable at 280 PPM until about a century ago when it rapidly increased, and is now around 423 PPM.
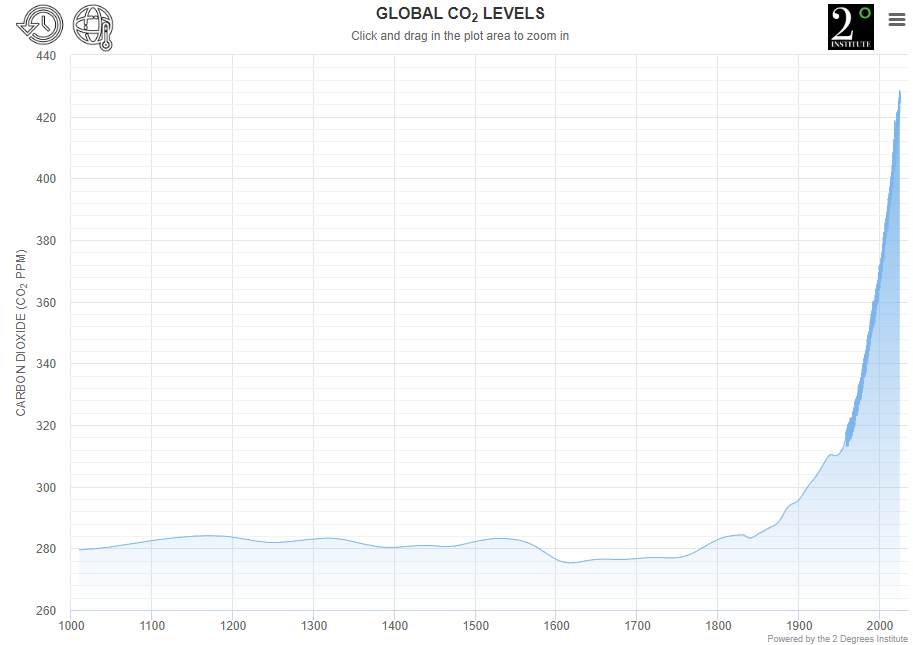
From CO₂ and other greenhouse gases (GHG) we get a global average temperature increase, but CO₂ concentration is particularly easy to measure. However this is a lagging indicator, showing what has happened to the atmosphere to date. Both increased emission of GHGs, primarily by burning fossil fuels, and also to some extent by reducing their absorption, like cutting down forests.
We are near a peak in CO₂ emissions. It could have happened already, if it hasn’t, it will happen soon.
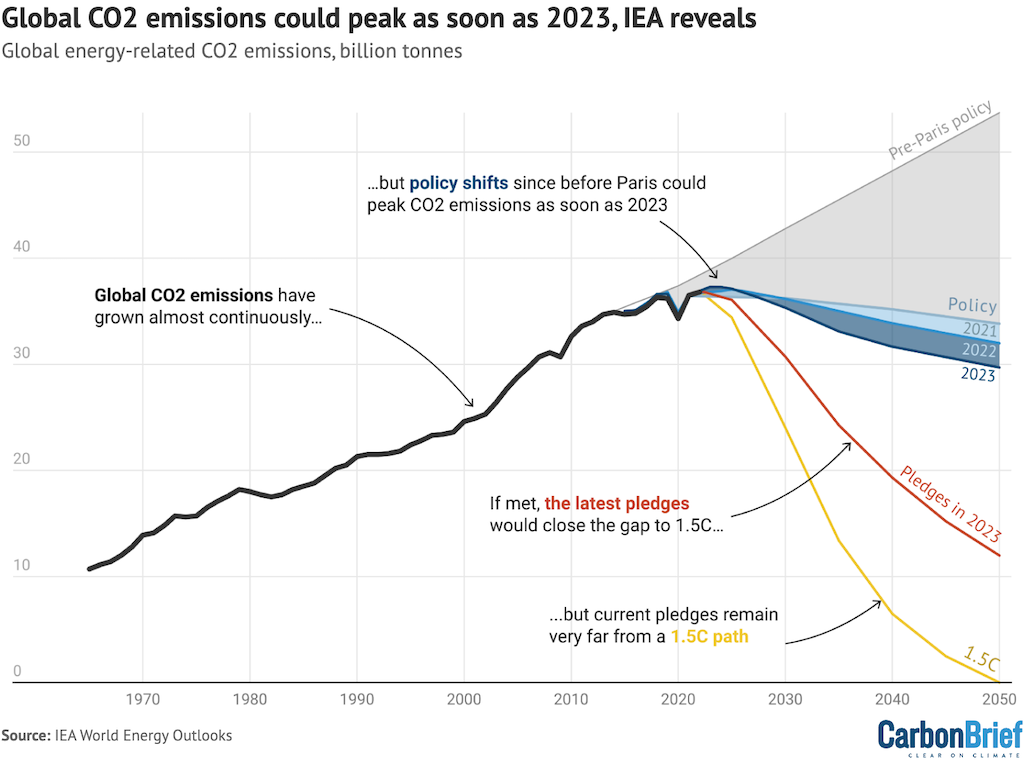
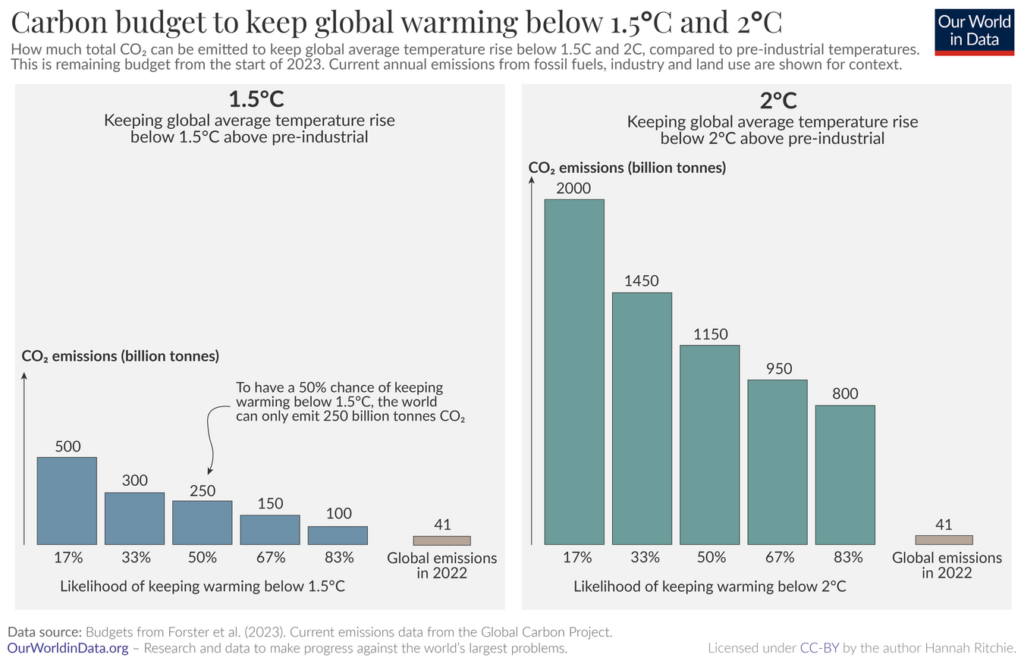
However, that we are no longer emitting more GHG every year, and start to emit less, doesn’t mean that the CO₂ concentration falls. It accumulates in the atmosphere, effectively leaving us with a “carbon budget”.
People at the peak
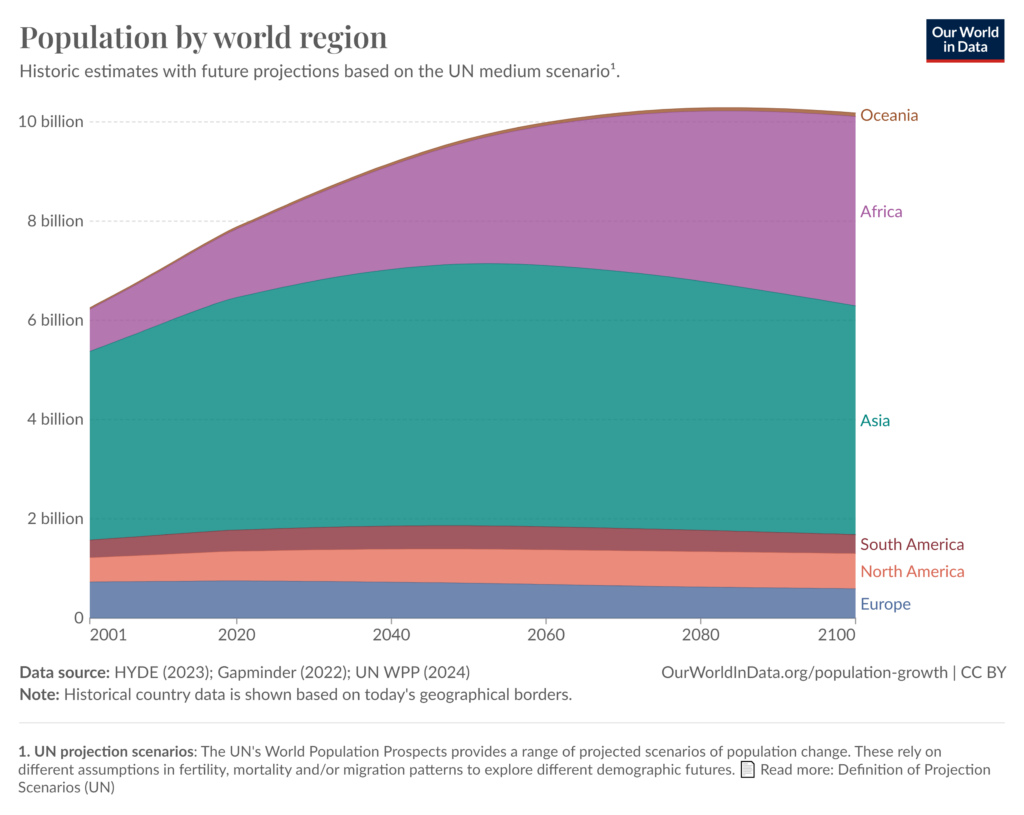
By UN medium scenario we will reach global peak population in 2082. Europe reached it in 2020, for South America it will be 2048, Asia 2052, and North America 2082, Africa just after 2100. These are based on estimates for births, deaths, and for the continents migration. This is primarily a lagging indicator. We see that more clearly if we subdivide by age group instead of continent.
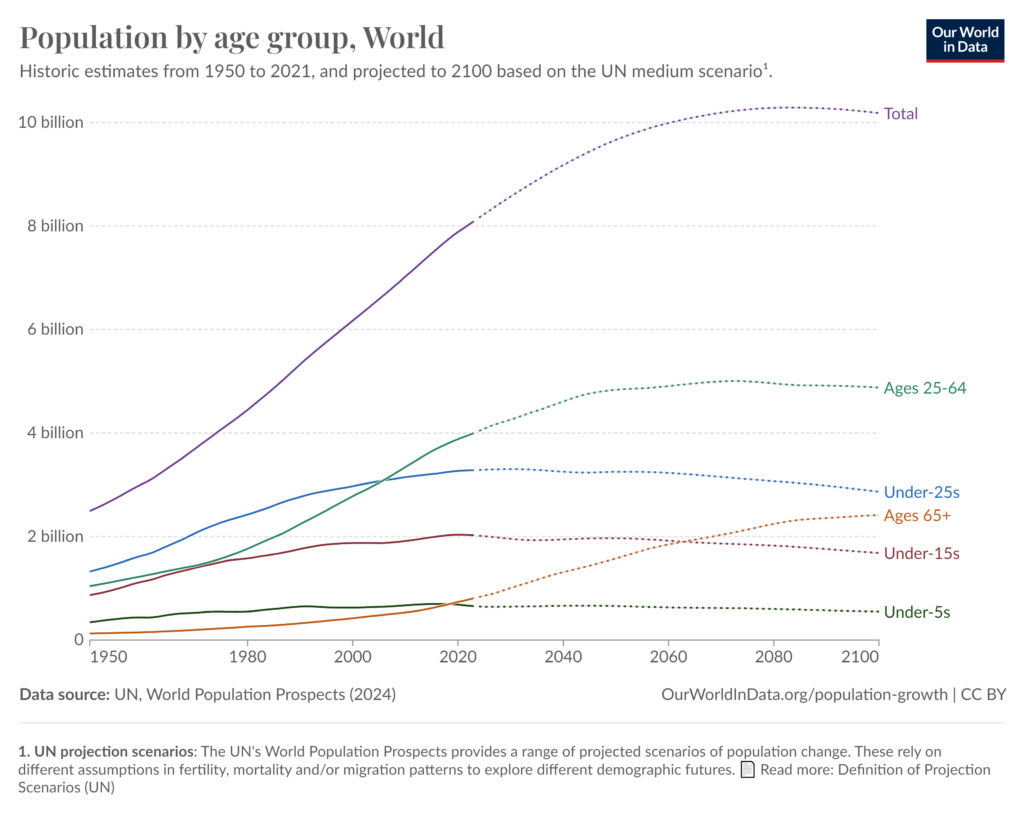
Age group 65+ will not peak this century at all. Age group 25-64 will peak in 2070, while children under 15 peaked in 2020.
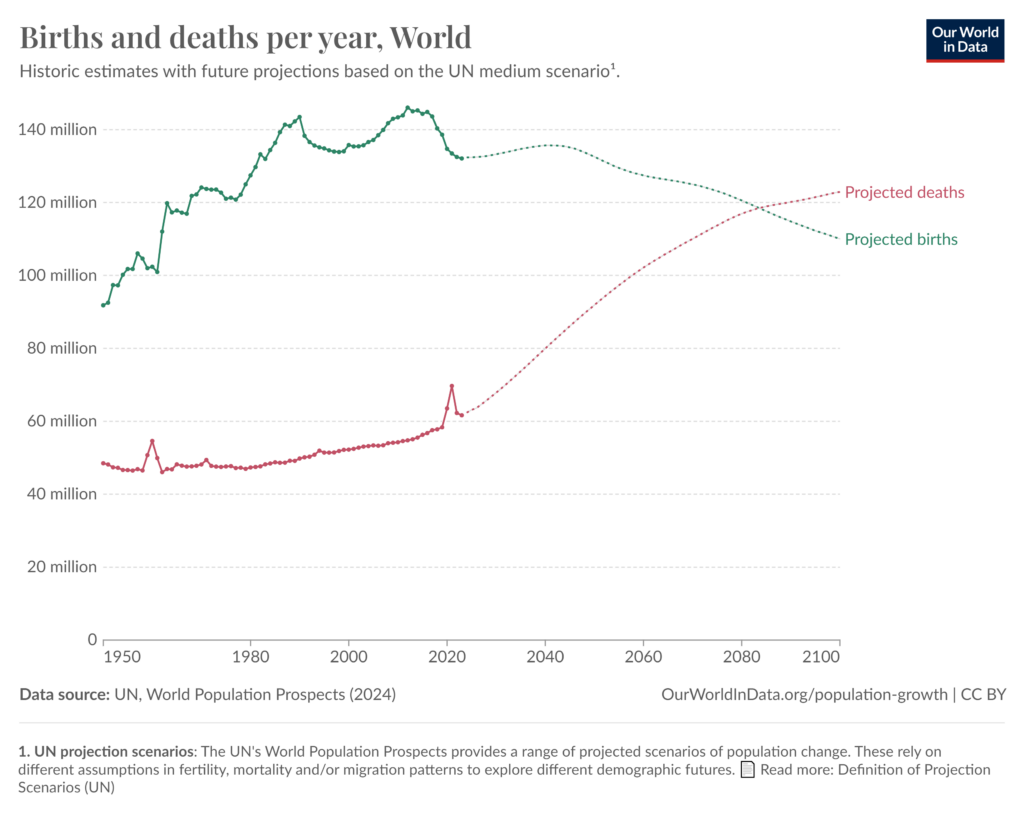
And number of births is the leading indicator. That peaked in 2012 with 146 million. In 2023 births have fallen to 132 million. Peak population, the year when deaths exceed births, is projected to happen 70 years after peak birth, in 2082.
Peak ICEV
The internal combustion engine (ICE) is nearing its end. For passenger cars the sale of ICE-only has already peaked, while sale of electric vehicles (EV) are growing fast.
Look to Norway
Norway, due to longstanding pro-EV policies, has been ahead of the curve. Sale of petrol cars peaked in 2004, diesel in 2011. The majority of new cars have been BEV since 2020 (since 2017 if including hybrids).
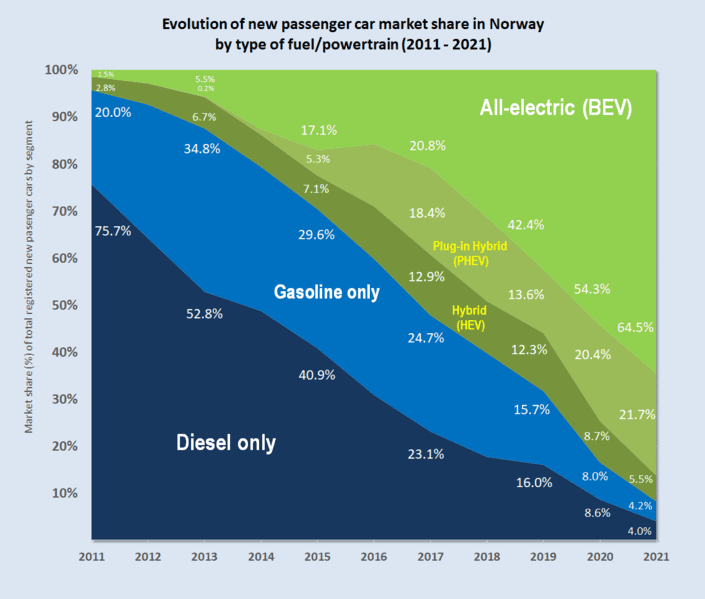
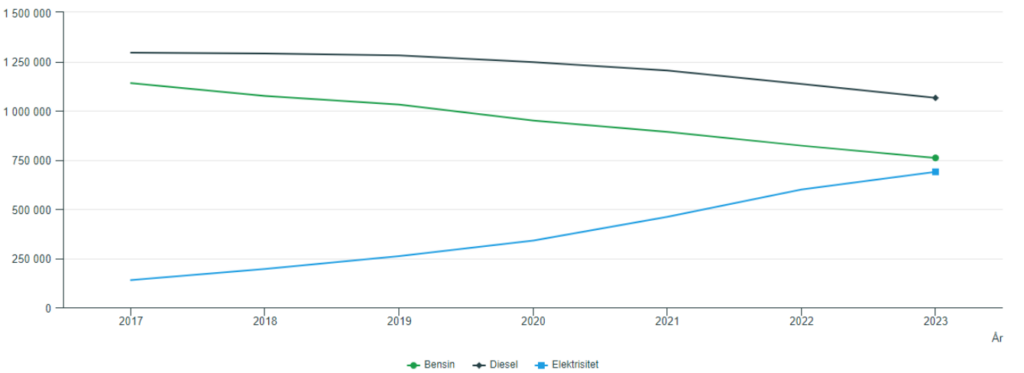
However, there is a significant lag from new car sales to the composition of the car fleet. In 2023 it comprised 63% fossil-only cars (37% diesel, 26% petrol), 13% hybrids, and 24% BEV. That in a year where only 1.4% of new cars were petrol, and 2.5% were diesel.
Norway reached peak ICE in 2015 for passenger cars. Car sales is very much a leading indicator.
And passenger cars are very much a leading indicator for other vehicles. While 37% of passenger cars are EVs, the corresponding numbers are 9% of busses, 6% of vans, 2% of lorries, and 0% of tractors and farm machines. As long as there are ICEVs in the transport sector, their emissions will accumulate.
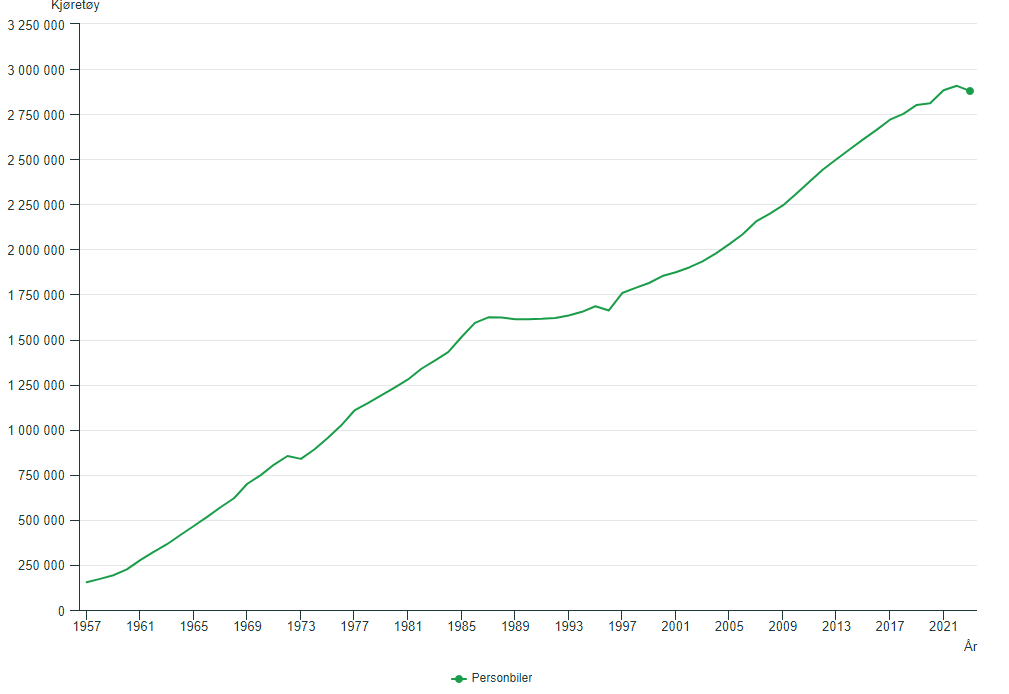
Also, Norway may recently be reaching peak car, at about one car per two people, half that of the US, three times the estimated world average. Early to tell, but increased urbanisation with better alternatives to driving may have that result. The recent dip looks primarily economic though, like elsewhere in the world car sales are down.
We can expect a similar lag from sales to vehicle fleet globally as in Norway. In 2021 the US Energy Information Administration expected that peak to come in 2038: EIA projects global conventional vehicle fleet will peak in 2038, however it is likely to happen sooner.
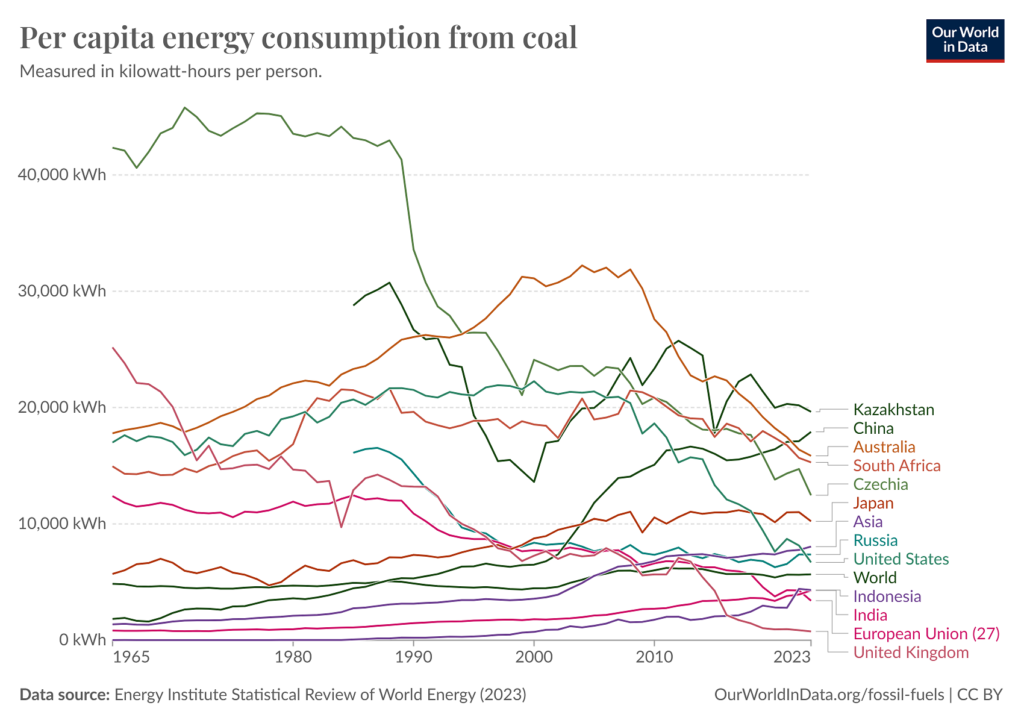
Peak coal
We now have more of a coal plateau than a coal peak, with two competing trends. Most of the world coal has either peaked or at least plateaued. In Asia coal is still rising.
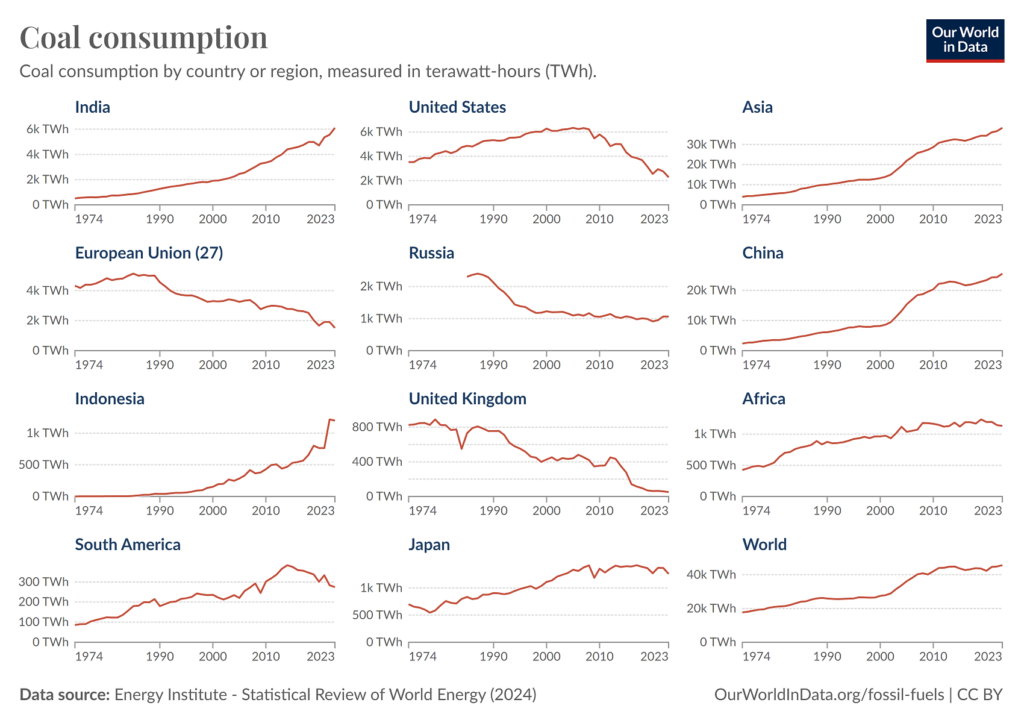
The UK peaked in 1979, EU 1985, Russia 1987, US 2007, Japan 2008, South America 2014. We may have reached global peak coal by 2024, the IEA expects so, but that depends largely on China, which burns half the world’s coal. If it doesn’t happen this year, it will happen soon, but China also had a false peak in 2013. Currently the largest increase is with India, where growth in energy demand rises faster than growth in renewables.
The major emitters are large. Measured per head the Asian countries are more in line with other countries, but still on the high side. Globally, consumption has been pretty flat, it has gone up by ⅙ over six decades, as it has shifted from the West to Asia.
If a small number of countries decide to stop smoking like the West has, we would in effect have phased out coal.
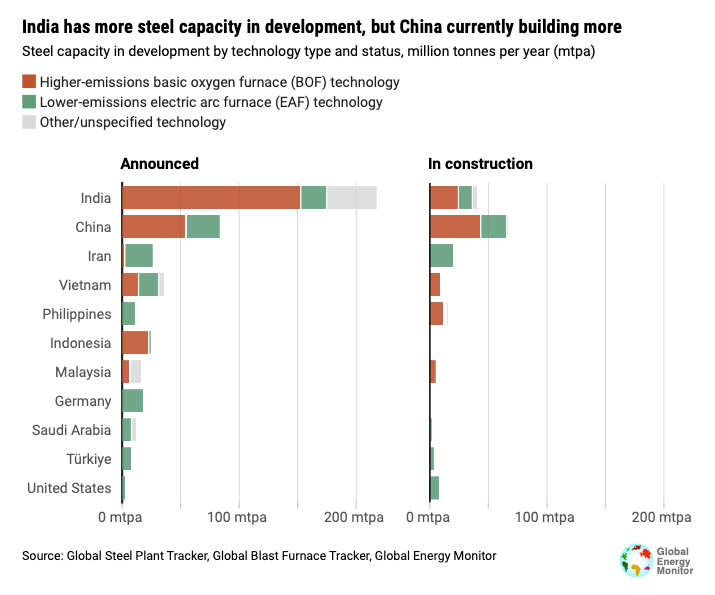
However, while ⅔ of coal consumption goes to power and heat, the rest is used for industrial purposes, ⅙ just to steel production. Industry too can transition to low-emission, but industrial plants are slower to adapt.
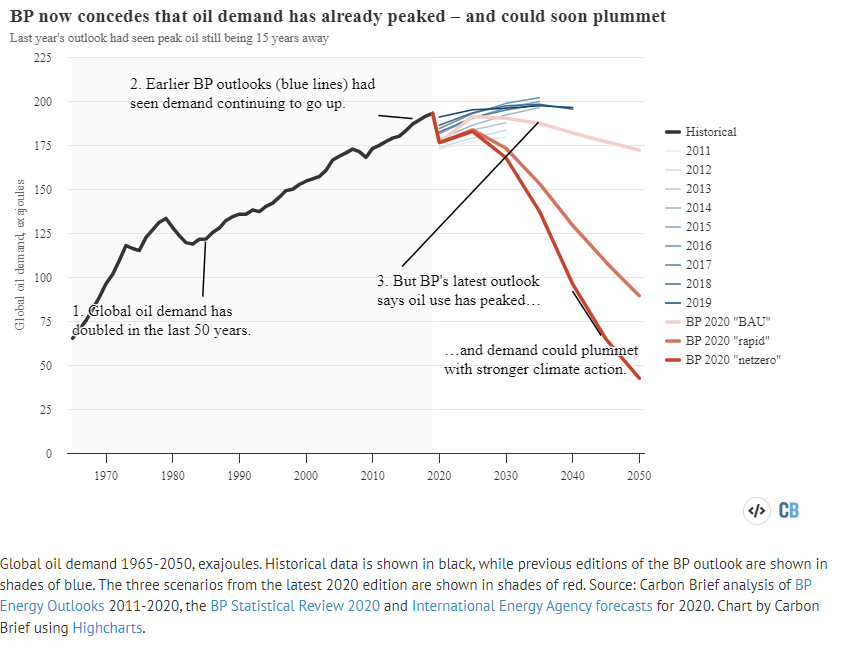
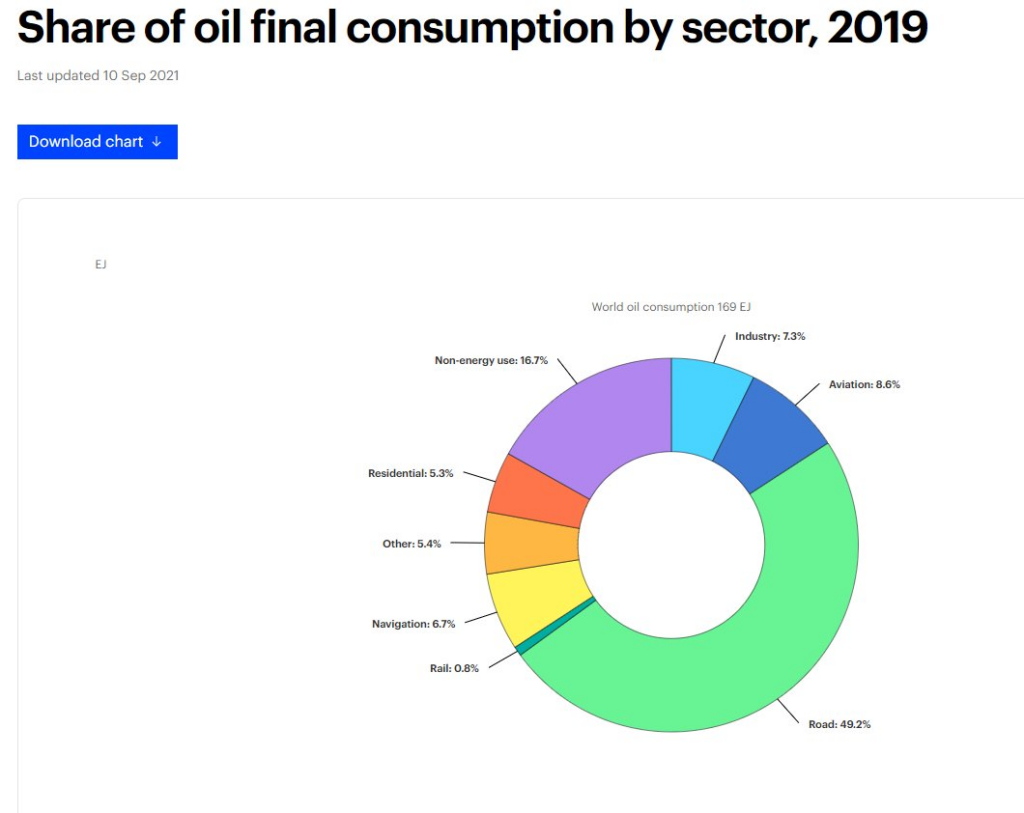
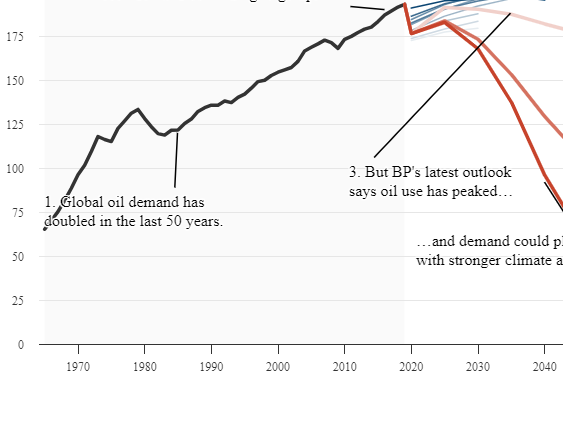
Peak oil
Our fossil oil demand may have peaked already. However, it is not the year it is peaking that matters, but how rapid the fall will be after the peak. Stopping the rise is not enough. It must fall, and fall fast.
As shown above, the total number of cars haven’t peaked, nor their size, but the number of cars with ICE engine have. As
Peak meat
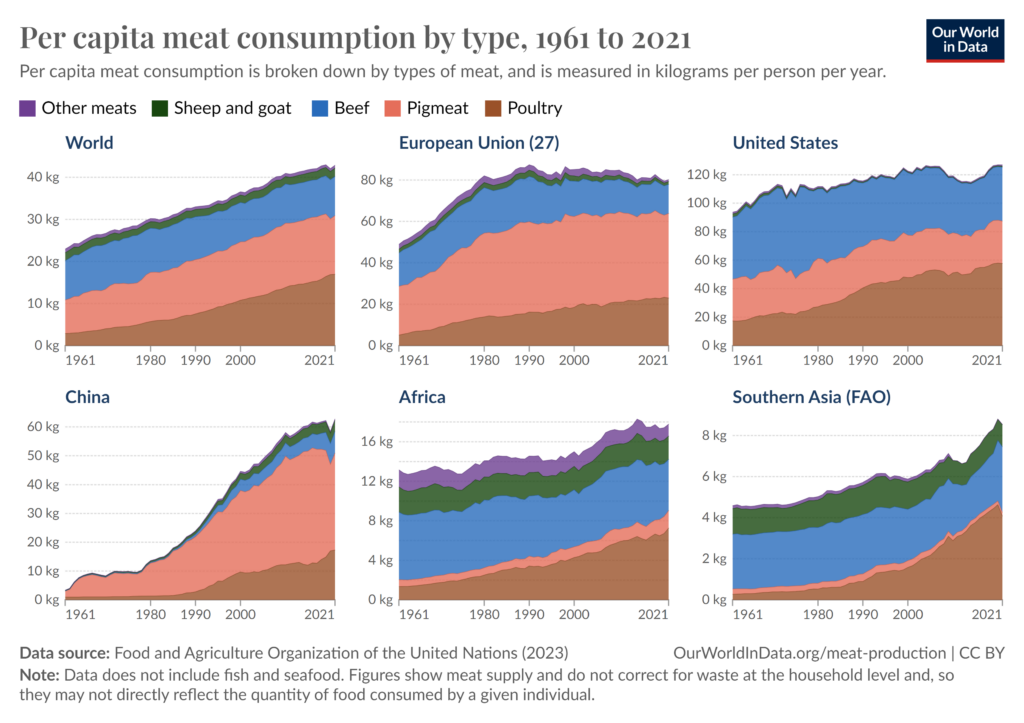
We have reached no global meat peak, but regionally we may have.
In 1990 the EU reached a peak of 87 kg meat per person per year, now it is 80 kg. The US may have reached their peak as well, at 127 kg, and China at 63 kg, but that remains to be seen.
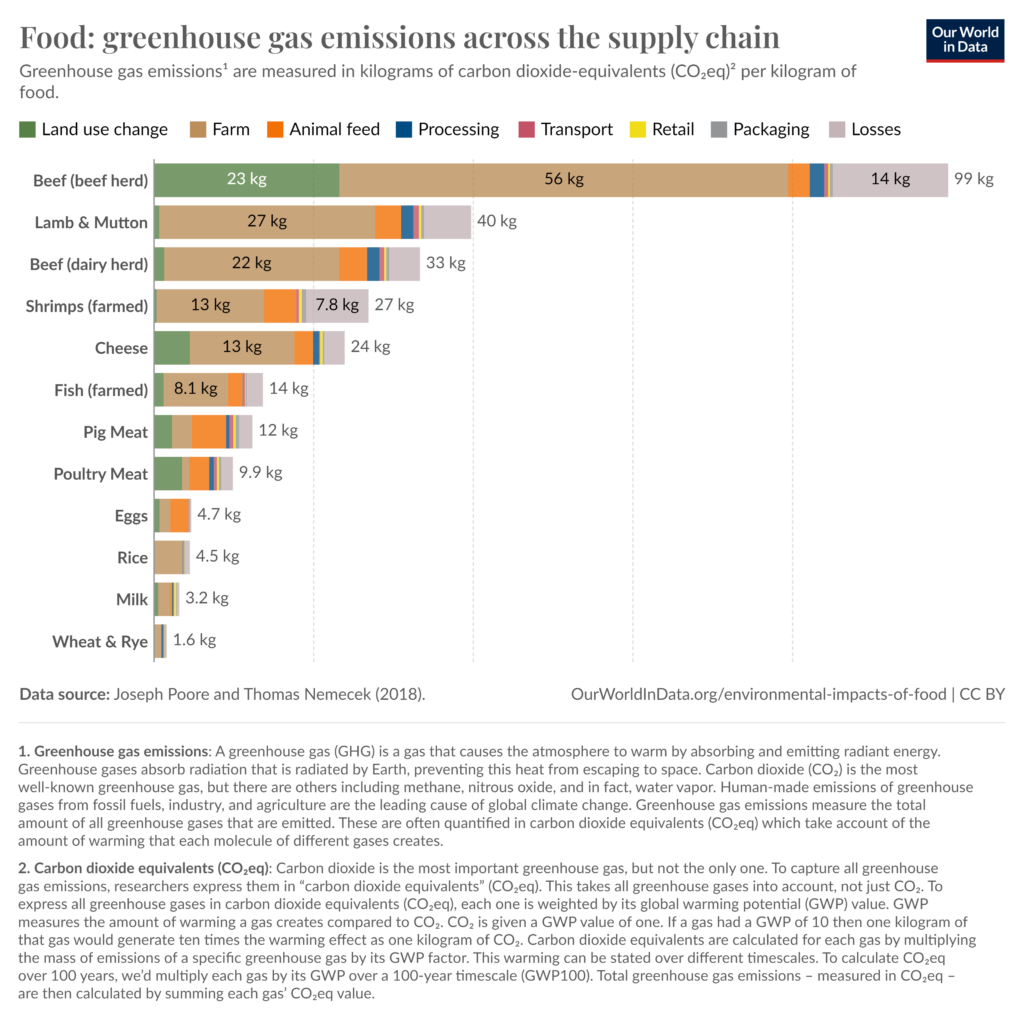
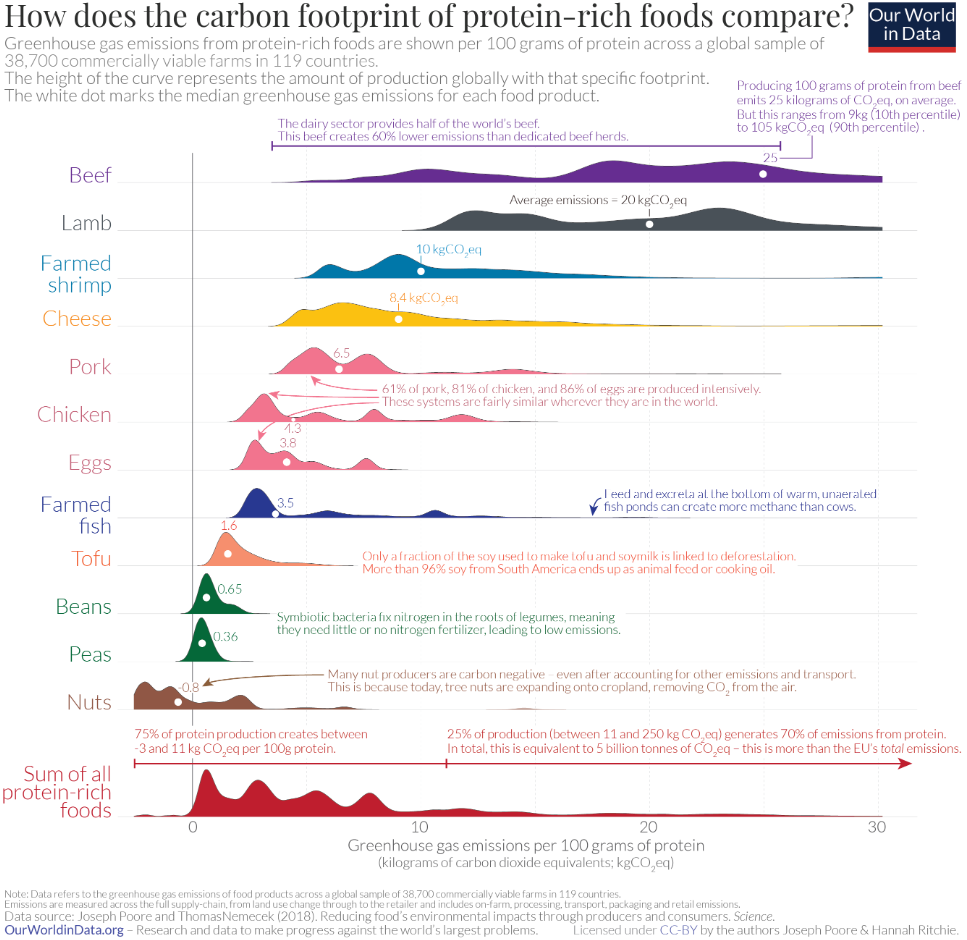
For emissions, meat production is practically the only thing that really makes a difference, but food production can have other environmental consequences as well.
Peak meat, either by fewer people eating meat and/or people eating less meat, will have a large impact on (peak) emissions, but this could also happen by improving production techniques. As you can see there is a huge difference between types of meat, but also in how they are produced.
Peak fossil power
It’s all downhill from here
How do you know you have reached the peak? When there are no taller peaks around, something that can in principle only be realised in hindsight. But when disruptive change happens, those drivers that pushed up the numbers may no longer do so.
Better batteries led to EVs outcompeting ICEVs, and there will be no triumphant resurgence for the combustion engine. Nor will there be any comeback for fossil fuels either. When we stop burning stuff there is no motive to start again, not even nostalgia.
Not everything here is experiencing disruptive change. We are not at peak car for instance. Maybe we will soon, maybe we won’t. One obvious competitor to the car is the videoconference. If we work more from home, we will commute less, and commuting is the prime motive for driving a car. There are more, perhaps better, alternatives to a car. Maybe we will have fewer cars being used more. A private car is in motion only a few percent of the day. All that is possible, but is not happening yet.
The global population is collapsing, if by “collapse” we mean an unrelenting decline over many generations. Thus, we are at a peak, several peaks, but maybe getting many children will come back in fashion again. Possible, but like with all demographic change, it is slow and won’t happen any year soon.
Maybe meat will be back, and people will eat more meat, rather than less. Maybe novel meat, or meat not coming from dead animals. Not happening yet, either.
How far, how fast?
So we are now at a stage where our indicators are turning. Instead of becoming larger, they are getting smaller.
Let’s look closer at BP’s scenarios for oil demand. The blue lines are earlier demand estimates from earlier years, but the three current scenarios (“business as usual”, “rapid” and “net zero”) are dramatically different. They all show us peaking, but the “business as usual” scenario falls at a very slow rate, and “net zero” at a fast one. Roughly the latter will reach zero in 40 years, while an extrapolation of “business as usual” will take us to the 24th century before the fossil era has ended.
Being at the turning points gives us great opportunities and responsibility. Somebody living in the 2060s will have little impact, if any at all, on total GHG emissions, as they are already close to zero, and further mitigation already in motion. Likewise, there were less tools available back in the 1990s to reduce emissions, they were more costly, and their impact would be less (the research and product development at the time has on the other hand proven critically important).
The consequences of doing a little more, or a little less, are now at the highest. A smaller change now will be more effective than a larger change later. This is the time that we should speed up our effort to the best of our abilities.